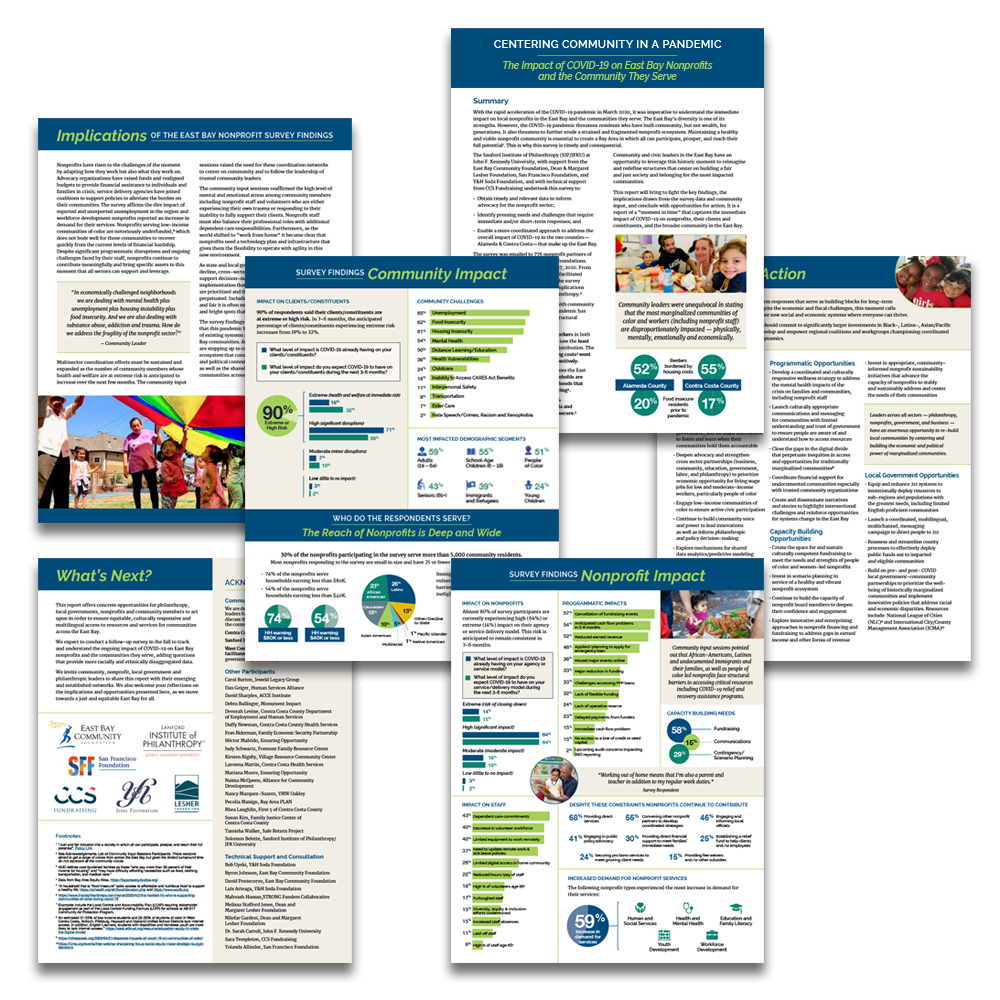
Report for a COVID-19 survey of nonprofits in San Francisco's East Bay. The report summarizes the effects of COVID-19 on area nonprofits through text and infographics.
Several hundred non-profits in San Francisco's East Bay participated in a survey about the impacts of COVID-19 on their communities and organizations. Page and section headers for each category separate the different sets of information.
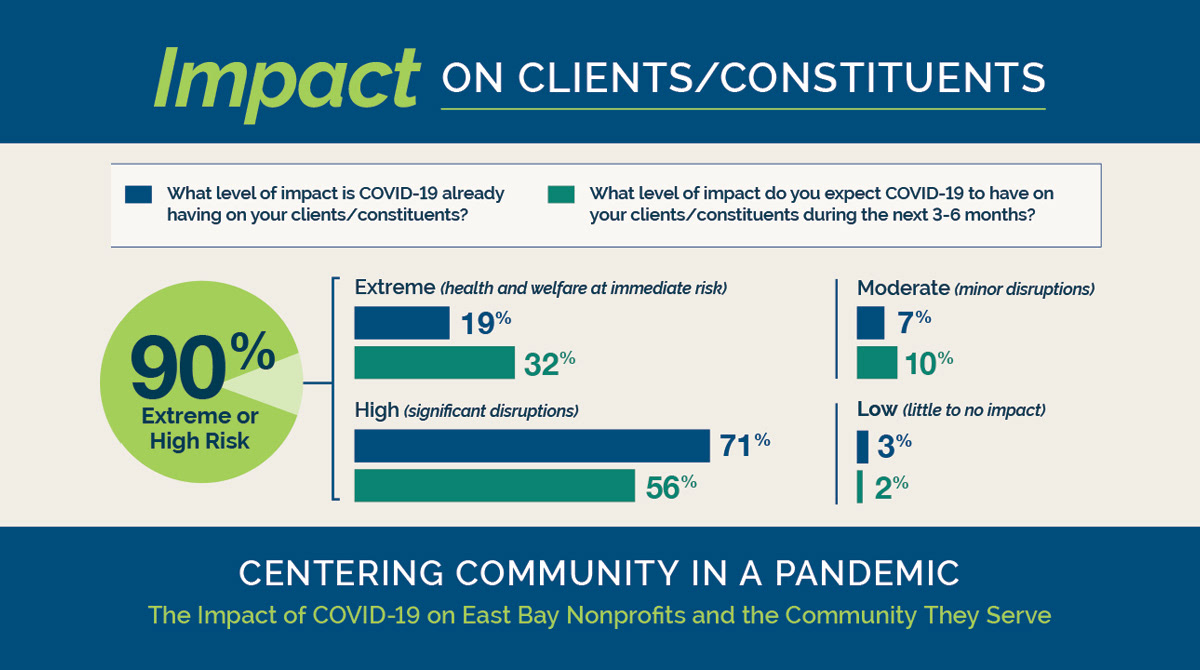
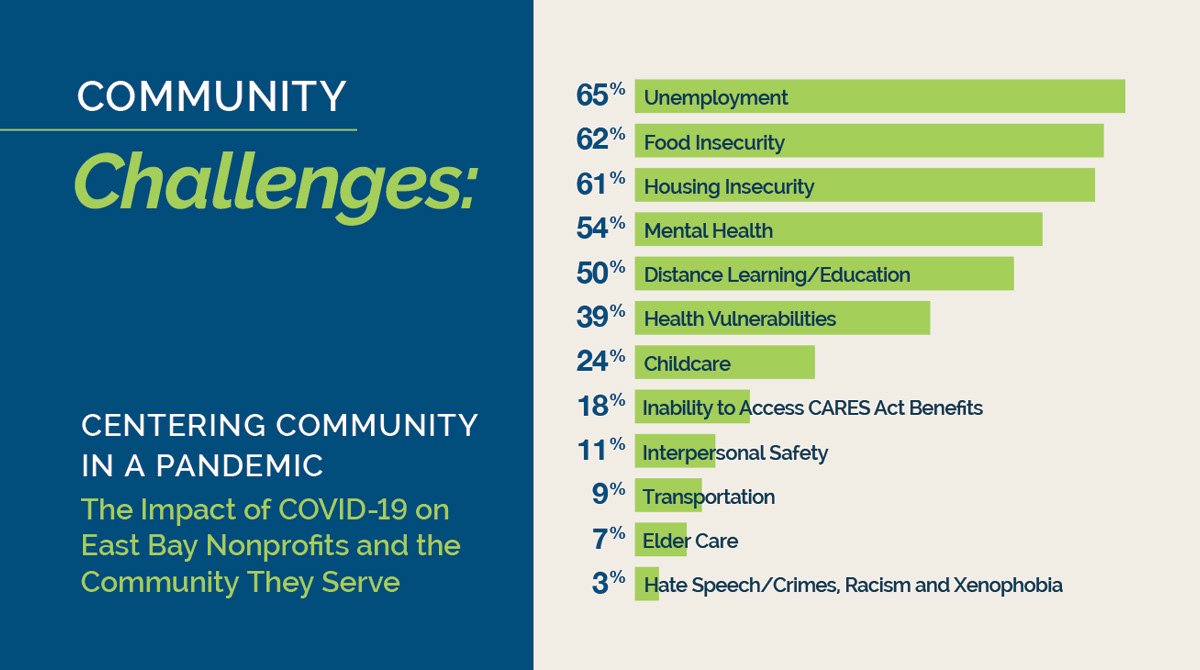
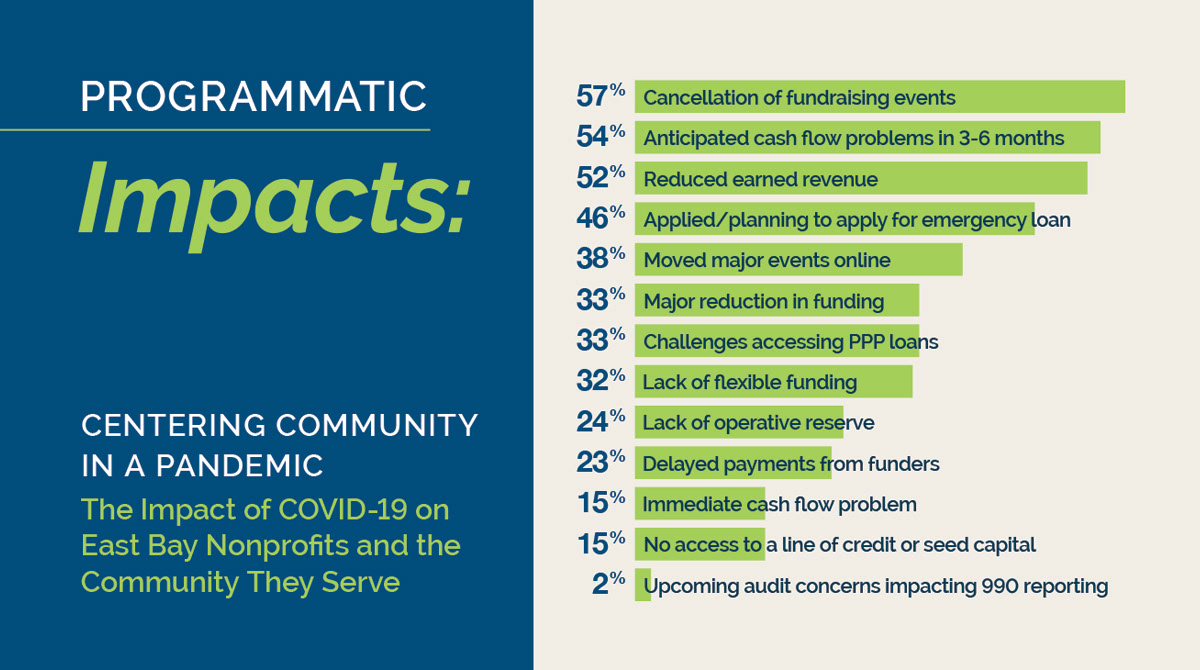
Two pages of infographics in the form of pie charts, bar charts, and icons show the specific results of the survey. A comprehensive text summary accompanies the results. I used callouts and additional infographics to call out important highlights and help make the pages more visually appealing.
Once the report was ready, the lead non-profits used social media to spread gain interest in the report. I separated some of the most intriguing graphics into bite-sized infographics for posting on LinkedIn and Twitter.